Project portfolio

The work behind the skills.

Explore the question, approach, findings, and limitations of each study. Open the reports and code to see how the work comes together.
Explore the source code ↗

21 projects

Data Analysis and Visualization

Pitchside Pro Revenue Performance Dashboard

The question

Build an executive dashboard that answers what is driving revenue performance over time and where the business should focus next to sustain growth.

The approach

I prepared the football ecommerce revenue dataset for executive analysis.

The output

The final dashboard gives a clear executive view of revenue performance, product growth, channel efficiency, football moment impact, and regional opportunity.

Power BIPower QueryDAX
Read case study: Pitchside Pro Revenue Performance Dashboard
Data Analysis and Visualization

Insurance Claims Analysis Dashboard

The question

Build a clear Power BI dashboard that helps users explore insurance claims and understand the main reasons behind claim amounts.

The approach

I cleaned and prepared the insurance data.

The output

The final dashboard gives a clear view of total claim amount, claim frequency, customer count, income patterns, insurance type, car model performance, and demographic claim trends.

Power BIPower QueryDAX
Read case study: Insurance Claims Analysis Dashboard
Data Analysis and Visualization

Hotel Bookings Analysis Dashboard

The question

Build a clear Power BI dashboard that helps users explore hotel booking performance and understand the main reasons behind cancellations, occupancy changes, and booking trends.

The approach

I cleaned and prepared the hotel bookings data.

The output

The final dashboard gives a clear view of booking trends, cancellation patterns, market segment performance, occupancy rate, lead time, and average daily rate.

Power BIPower QueryDAX
Read case study: Hotel Bookings Analysis Dashboard
Data Analysis and Visualization

HR Analytics Dashboard

The question

Build a clear Power BI dashboard that helps HR teams explore employee attrition, salary patterns, satisfaction scores, and workforce trends.

The approach

I cleaned and prepared the HR employee dataset.

The output

The final dashboard gives a clear view of employee attrition, workforce structure, salary trends, satisfaction scores, and HR performance indicators.

Power BIPower QueryDAX
Read case study: HR Analytics Dashboard
Data Analysis and Visualization

IT Help Desk Dashboard

The question

Build a clear Power BI dashboard that helps IT teams monitor ticket performance, improve SLA tracking, understand resolution delays, and manage help desk workload.

The approach

I cleaned and prepared the IT help desk ticket dataset.

The output

The final dashboard gives a clear view of help desk performance, ticket workload, SLA compliance, agent productivity, resolution speed, and customer satisfaction.

Power BIPower QueryDAX
Read case study: IT Help Desk Dashboard
Data Analysis and Visualization

LEGO Sets Analysis Dashboard

The question

Build a clear Power BI dashboard that helps users explore LEGO sets, compare themes, understand price trends, and identify top-performing sets.

The approach

I cleaned and prepared the LEGO sets dataset.

The output

The final dashboard gives a clear view of LEGO set growth, theme popularity, pricing patterns, minifigure distribution, piece count trends, and detailed set performance.

Power BIPower QueryDAX
Read case study: LEGO Sets Analysis Dashboard
Data Analysis and Visualization

Mexico Toy Sales Dashboard

The question

Build a clear Power BI dashboard that helps users explore toy sales performance, product profitability, category revenue, and store-level insights.

The approach

I cleaned and prepared the toy sales dataset.

The output

The final dashboard gives a clear view of sales revenue, profit, orders, product performance, and store performance.

Power BIPower QueryDAX
Read case study: Mexico Toy Sales Dashboard
Data Analysis and Visualization

Shark Tank Data Analysis Dashboard

The question

Build a clear Power BI dashboard that helps users explore Shark Tank performance, compare investors, identify top industries, and understand startup deal patterns.

The approach

I cleaned and prepared the Shark Tank dataset.

The output

The final dashboard gives a clear view of Shark Tank deal trends, top industries, startup performance, investor behavior, pitcher distribution, and investment patterns.

Power BIPower QueryDAX
Read case study: Shark Tank Data Analysis Dashboard
Data Analysis and Visualization

Spotify Music Streaming Analysis Dashboard

The question

Build a clear Power BI dashboard that helps users explore music streaming performance, compare artists and tracks, analyze chart rankings, and understand Spotify trends against other music platforms.

The approach

I cleaned and prepared the Spotify music streaming dataset.

The output

The final dashboard gives a clear view of Spotify track performance, top artists, streaming trends, chart presence, playlist performance, and cross-platform comparisons.

Power BIPower QueryDAX
Read case study: Spotify Music Streaming Analysis Dashboard
Data Analysis and Visualization

Udemy Courses Analysis Dashboard

The question

Build a clear Power BI dashboard that helps users explore Udemy course performance, compare subjects, understand revenue trends, and identify popular courses.

The approach

I cleaned and prepared the Udemy course dataset.

The output

The final dashboard gives a clear view of Udemy course performance, subject distribution, revenue trends, course popularity, price distribution, and subscriber behavior.

Power BIPower QueryDAX
Read case study: Udemy Courses Analysis Dashboard
Data Analysis and Visualization

Annual Number of Deaths by Cause Analysis Dashboard

The question

The goal of this project was to transform complex global mortality data into an interactive analytics solution that helps users explore trends, compare countries, identify major causes of death, and understand long-term healthcare patterns.

The approach

The dataset was cleaned, transformed, and modeled in Power BI

The output

The final dashboard provides a user-friendly interface for exploring global mortality patterns.

Microsoft Power BIPower QueryDAX
Read case study: Annual Number of Deaths by Cause Analysis Dashboard
Data Analysis and Visualization

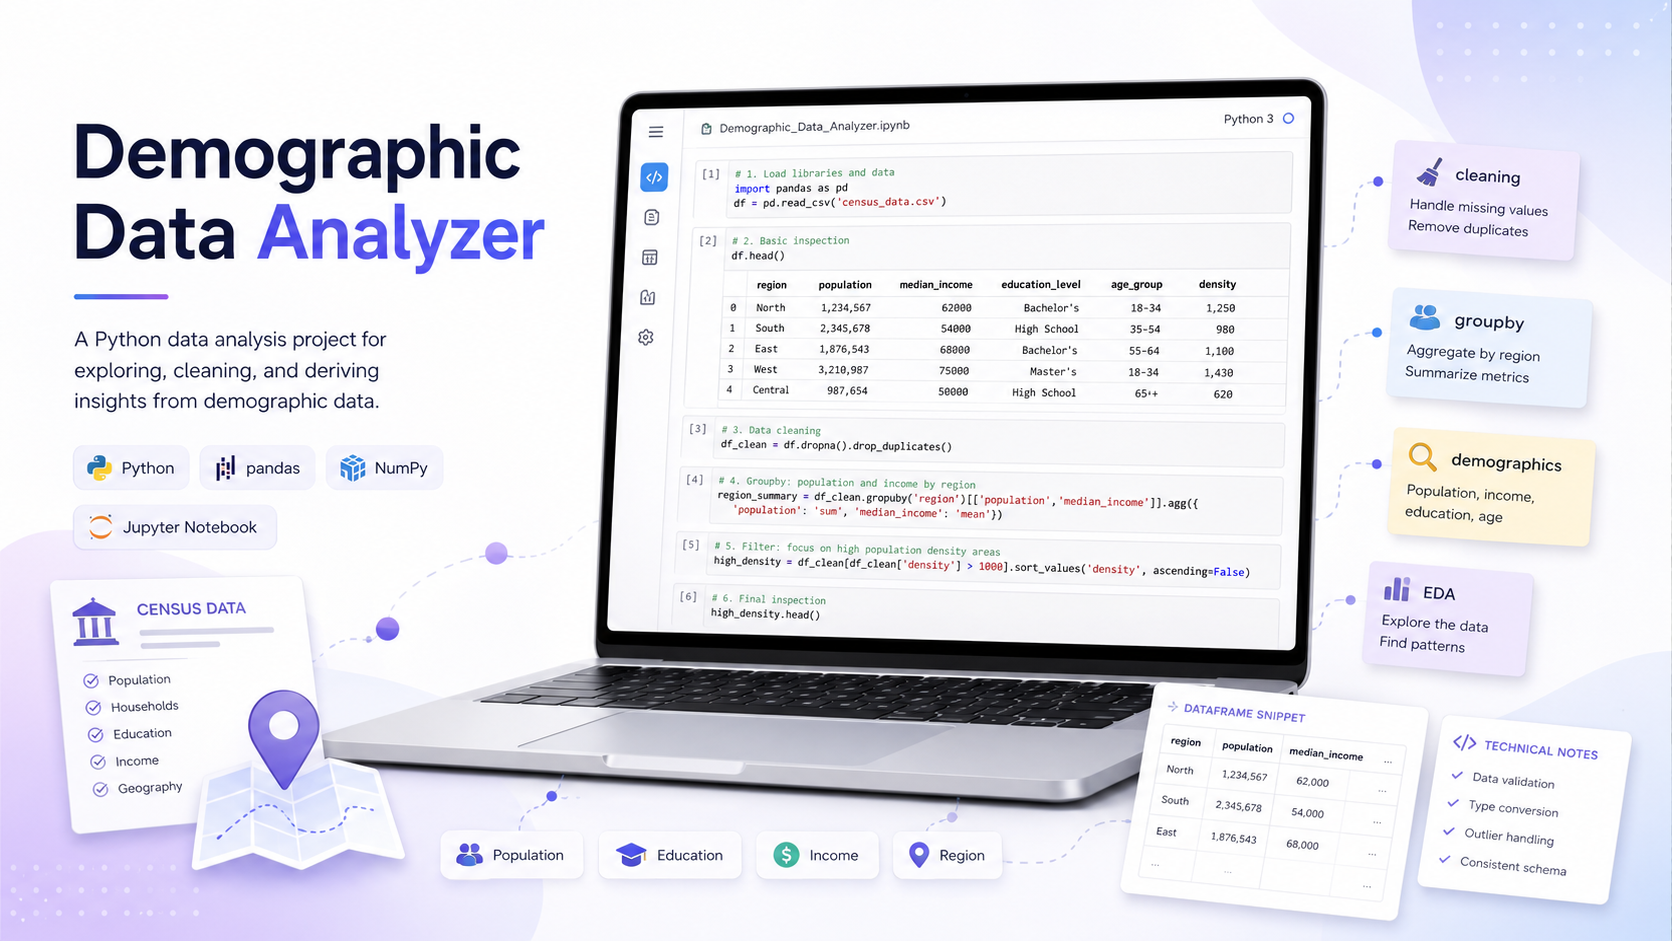
Demographic Data Analyzer

The question

Use Python to analyze demographic data and answer clear questions about income, education, work patterns, and population groups.

The approach

Loaded and explored the demographic dataset with Pandas.

The output

Delivered a clean Python analysis that explains important demographic patterns.

PythonPandasJupyter Notebook
Read case study: Demographic Data Analyzer
Natural Language Processing NLP

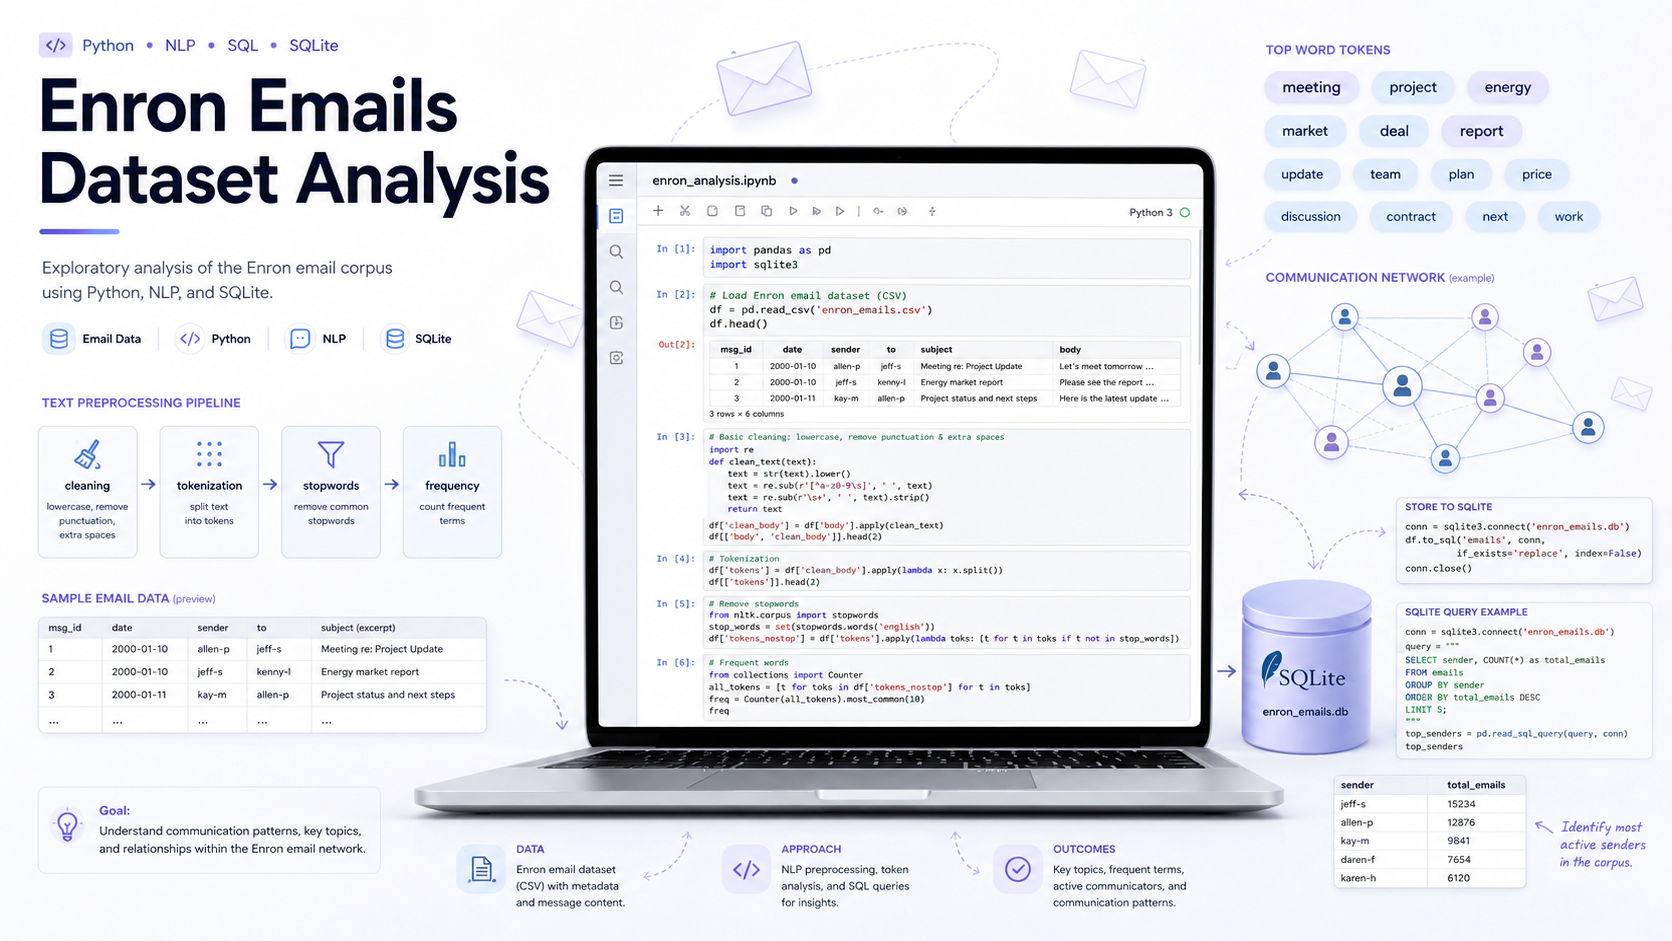
Enron Emails Dataset Analysis

The question

Analyze email communication patterns, message volume, important senders, recipients, and common topics from a real-world email dataset.

The approach

Connected to the SQLite email database.

The output

Produced insights about email volume, senders, recipients, recipient types, and common topics.

PythonSQLitePandas
Read case study: Enron Emails Dataset Analysis
Data Analysis and Visualization

Restaurant Order Analysis

The question

Analyze restaurant order data to find useful insights about products, categories, and customer demand.

The approach

Cleaned and explored restaurant order data.

The output

Created a clear restaurant order analysis that supports menu and sales decisions.

SQLPythonPandas
Read case study: Restaurant Order Analysis
Data Analysis and Visualization

Airbnb Listing Analysis

The question

Analyze Airbnb listing data to understand pricing, availability, room types, and location-based market patterns.

The approach

Prepared Airbnb listing data for analysis.

The output

Delivered an Airbnb listing analysis that explains pricing and listing patterns.

PythonPandasData Cleaning
Read case study: Airbnb Listing Analysis
Machine Learning and AI

Housing Prices Prediction

The question

Build a regression model that estimates housing prices and supports real estate pricing analysis.

The approach

Prepared housing price data for machine learning.

The output

Created a housing price prediction workflow that estimates property prices from structured data.

PythonPandasScikit-learn
Read case study: Housing Prices Prediction
Machine Learning and AI

Prediction of Obesity Risk

The question

Build a classification model that helps identify obesity risk categories from health-related features.

The approach

Prepared health and lifestyle data for classification.

The output

Created a predictive model for obesity risk classification.

PythonPandasScikit-learn
Read case study: Prediction of Obesity Risk
Natural Language Processing NLP

Sentiment Analysis Dashboard

The question

Build a sentiment analysis dashboard that helps users understand text feedback at scale.

The approach

Prepared text data for sentiment analysis.

The output

Delivered a sentiment analysis dashboard that turns text feedback into clear insights.

PythonNLPPandas
Read case study: Sentiment Analysis Dashboard
Machine Learning and AI

Movie Recommendation System

The question

Build a recommendation system that helps users discover relevant movies from a larger catalog.

The approach

Prepared movie data for recommendation analysis.

The output

Created a working movie recommendation project that demonstrates personalization and recommendation system thinking.

PythonPandasMachine Learning
Read case study: Movie Recommendation System

Let’s talk

A role to fill.
A data problem to solve.

Open to employment & freelance projects